Over the past few weeks, I have been on a hiatus from my normal work at Cerner. During this time, I have been working on several home repair and improvement projects. While I have been doing this work, I was reminded of something that I like to do which helps illustrate progress achieved in projects. In this short post, I will share a few things that I think are important to capture which leverage the power of contrast to highlight progress. By sharing the story of progress in your projects, you can help connect team members to purpose and their larger impact.
Home Improvements#
As a I mentioned, I have been doing several home improvement projects. I have gotten into a habit of always taking photos of the current state of something before I start to change it. Many times this is so I can actually remember how the thing was assembled, but it can also be used as a reminder of what it actually looked like before. If you just look at the final product, you are many times satisfied, and may be further impressed if you knew what it looked like before. However, when you have a photo of the before and the after, progress is quickly illustrated through contrast. It is like those home improvement shows where they summarize at the end of how bad something looked before and how it now looks after a remodel. When viewing the current state by contrasting it with the past, you can easily capture progress and the impact of the change.
While this is easy with physical things that we change, this is many times harder with software. With software changes, it isn’t always an easy task to illustrate how the software has changed. We many times use data that directed us to make the change (ex. the metric on response time was too high and should be lowered) to then show the impact. While sharing how metrics change is always interesting, I think how this information is delivered is something we should also focus on. By focusing on how our data is presented and delivered to our teams, we can increase the value of the metric in what people remember and realize from its benefits.

Visualize the Human Experience#
When trying to compare what life was like before your software change, I think it is helpful to capture a screen recording of the workflow in the previous state. For example, if you are comparing how this change will further optimize a user’s workflow, having it illustrated by an expert is a great artifact to then compare. Gathering a screen recording of the workflow also captures the timing of the software and any non-optimal workflows of using it (which you can then highlight later). This recording can be played side-by-side (before and after), which shows timing differences, and possibly less steps in the workflow. I have used this before to share with others how much their change had an impact of what it was like before, as the contrast is quite large in comparison. Furthermore, when you share the story that the person who recorded the workflow is an expert in using it, it also allows the audience to visualize others who would not be as proficient benefiting even further. This point is somewhat important, in that you don’t want their imagination to go in the inverse, and think “Yeah, that looks impactful for new users, but most people who are experienced wouldn’t get that big of a benefit.” Furthermore, by showing the previous state, you are also informing others what life is like in the software, as you will find newer team members which do not have this context or simply existing team members that have gotten disconnected from the actual user experience.
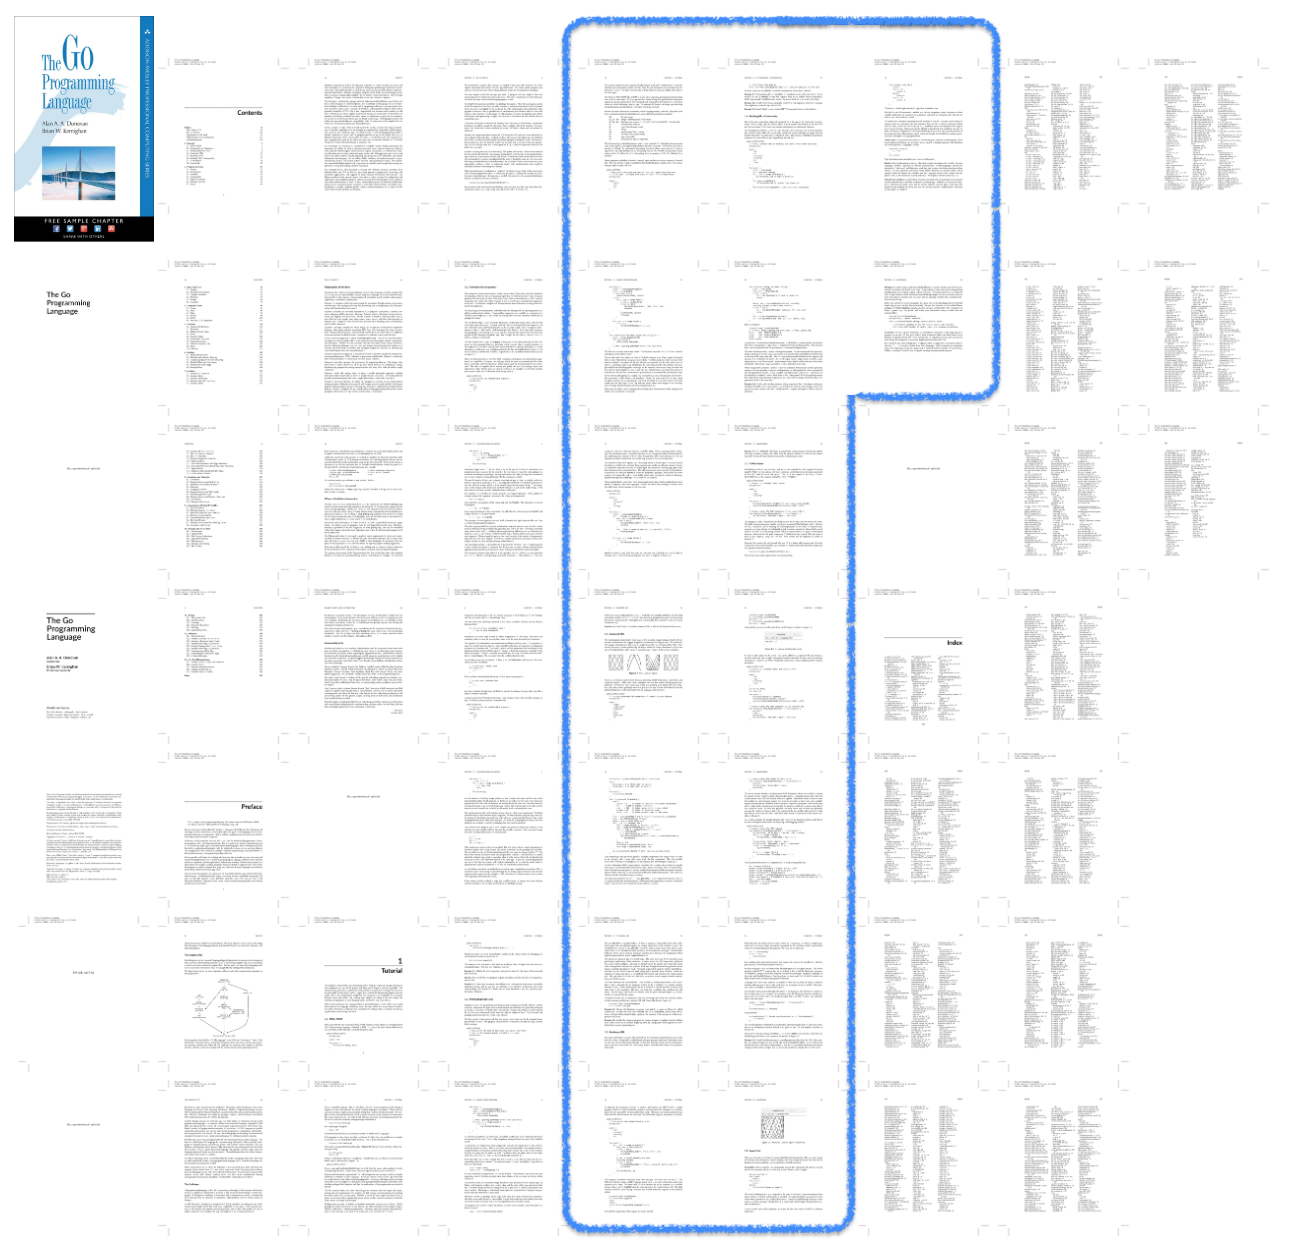
Sometimes our software changes are automating other manual tasks, which you would have to essentially video record someone to see what they would have done before to provide a contrast. One thing I have seen people do is capture the amount of time it takes someone to do it manually, and show how that time isn’t spent anymore. This is a common practice to identify the cost of something based on human hours required, but many times when this is shared as just a number, it can seem weak based on its actual impact. A number doesn’t quickly produce a visualization of the painstaking time and frustration that is removed from the user, it is just a number. In a similar scenario, I found how the process we were automating had a process guide, which had many pages of steps. I decided to build an image which was a mosaic zoomed-out view of all these pages. This visual look intimidating on the size of the document, and alluded a bunch of complexity (without having to explain anything about it). I then shared how many pages were comprised in this guide, and then you could include the human time it would take. By showing a visual of something like pages of the process it took before, and how we were reducing it (highlighting a section that would be removed), it strengthened the point more than just a number which doesn’t carry much emotional power when initially shared.
To generate this visual, here is an example using The Go Programming Language (the free sample chapter). With this, I generated an image per page, then generated an HTML table of all the images. From this view, I take a screenshot and then may highlight a section of content that we would be removing through automation. This gives context of what you are removing, by contrasting what already pre-exists.
Avoid Pie Charts#
Since we often like to illustrate metrics with charts to illustrate change, I felt that I should share one of my opinions on charts: avoid pie charts. There are different tools that I use which will recommend for a given distribution of numbers to share it in a pie chart, rather than the good ole bar chart. Why should you avoid pie charts and favor bar charts? Here are a few:
- Lack of contrast: Since this post is about contrast, pie charts don’t make it obvious of relative contrast to others. If you have five different percentages, and two of those are very close (ex. 23% and 25%), it isn’t obvious from a quick glance the contrast between the two. Which one is larger or smaller?
- Lack of order: Feeding off of the lack of contrast, there isn’t an obvious order to the metrics, so you aren’t able to quickly see the order and comparison between the numbers. With a bar chart, it is easy to order them, so when the numbers may be very close, the contrast still exists through a clear ordering scheme (ex. top to bottom or left to right).
- Suffering from several numbers: If you have just a few numbers you want to compare (like three to five), a pie chart can struggle with this. Once you get more than just two numbers to show distribution, the pie chart makes it difficult to understand the difference of relative size. This then invites labeling it to make it obvious, and then you are just adding more content.
While I believe pie is one of the best members in the desert family, I would avoid using it in visualizations when you want to illustrate contrast between these numbers.

Summary#
I thought it would be a good reminder to not forget to capture the story of what something was like previously before you changed it, and then show the comparison after the change is applied. By presenting these two together, you can leverage the power of contrast to highlight the impact of the change. This also avoids making any assumptions on the audience knowing what it was even like before. When doing this, you strengthen the point of progress on changes your team is making and the impact they serve. Seek to find ways to share the impact your team is making, and leverage the power of contrast in sharing the story.